Decisions and operational clarity
Dashboards ≠ decisions. Why reporting doesn't provide the clarity you need?
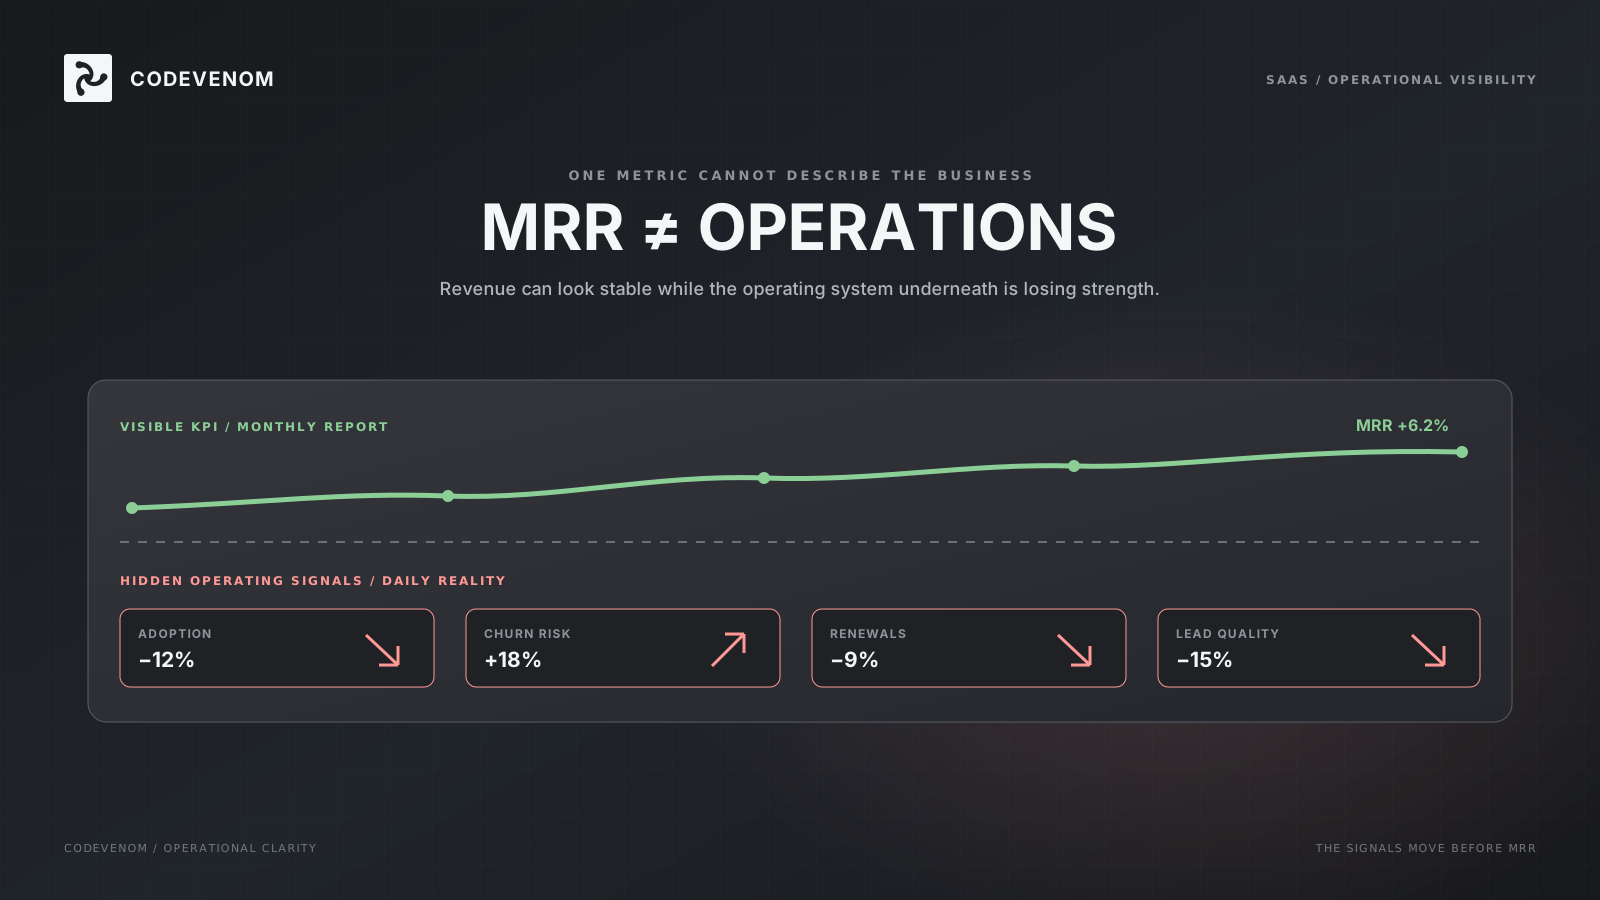
In many companies, dashboards are up-to-date, aesthetic, and full of data - yet decisions are still made with a delay or based on 'gut feeling'. The problem does not lie in the quality of reporting, but in the fact that reports describe the past instead of supporting decisions. This article explains why dashboards rarely provide the clarity that management really needs.
In most growing companies, reporting 'works'.****
Dashboards are available, data is refreshed, numbers match. Sales sees the pipeline, finance sees the result, and management receives regular summaries. From the outside, it looks like a mature data-driven organization.****
And yet something is off.****
Decisions are still being postponed. Meetings are getting longer. The need for 'additional report' or 'different data view' is increasingly common. Even though there is more information than ever, decision clarity cannot keep up with the company's pace.****
For many CEOs and CFOs, this is a disorienting moment. Since we have dashboards, KPIs, and reports - why is it still not clear, what to do next?****
It is not a tool problem. It is a problem of what reporting was designed for.
At the earlier stages, decisions in companies are simple because dependencies are visible. One dashboard or even one spreadsheet is enough to understand the situation. The scale is small, and the consequences of decisions are quick and clear.****
As the company grows, the nature of decisions changes.****
It's no longer about questions like "is the result good", but about questions like:****
-
why the result is this way and not another,****
-
what will be the consequence of this decision in a month,****
-
which area is really limiting growth.****
The problem is that reporting rarely evolves with this change. Dashboards still show metrics, but they don't help understand the relationships between them. The company grows, but the way of looking at data remains the same as in a smaller organization.

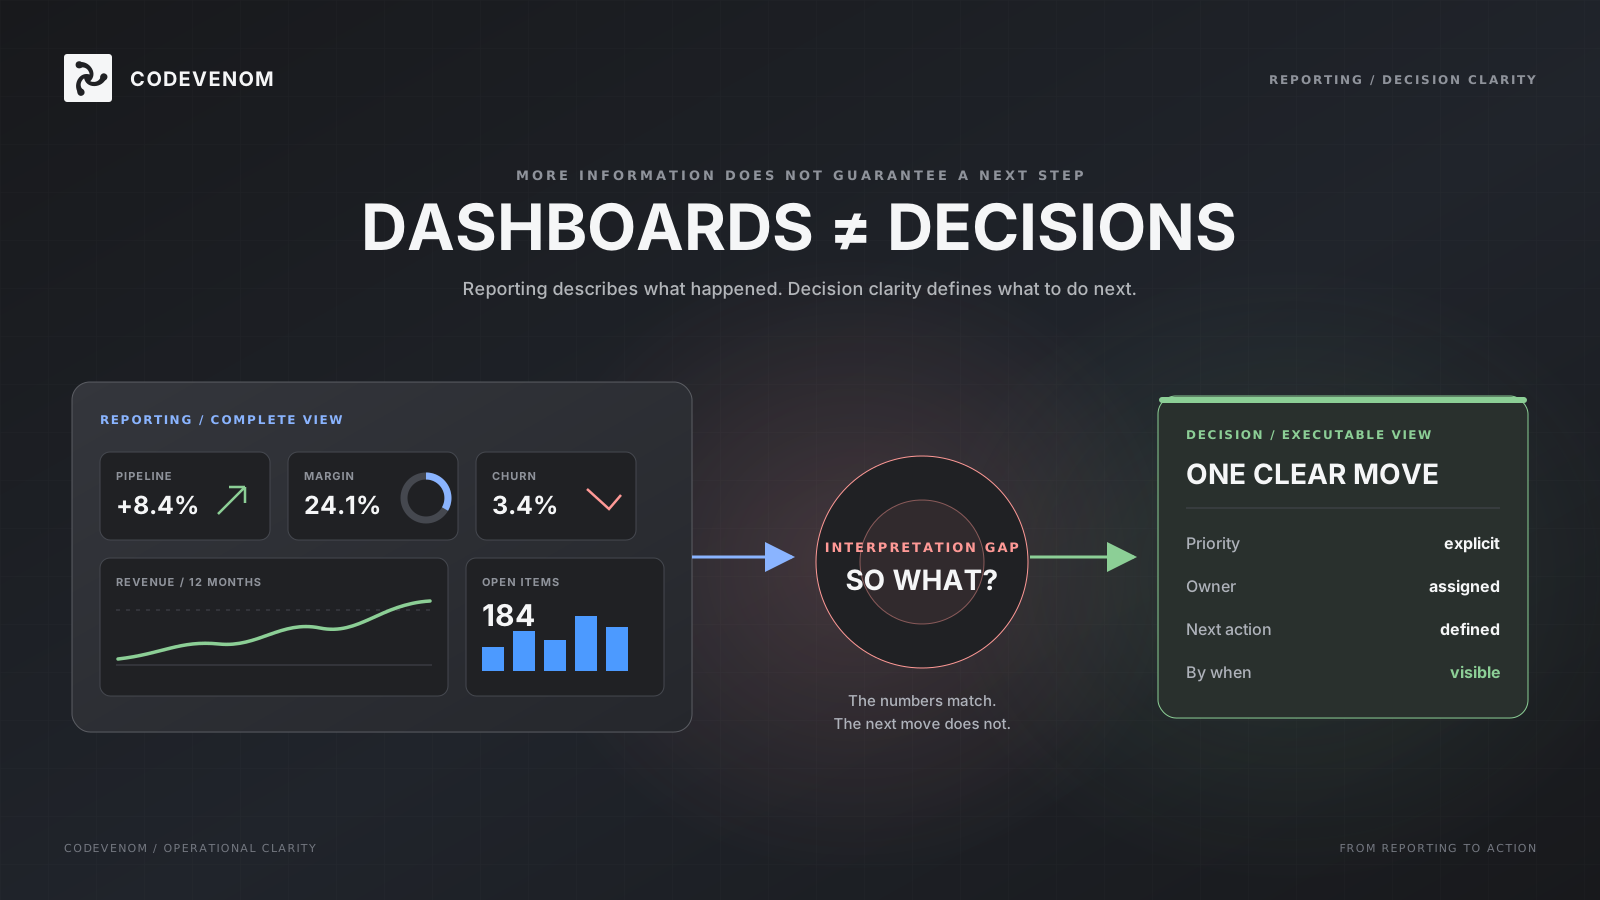
The dashboard answers the question: “what happened?”****
Management decision requires answering the question: “what does it mean and what to do about it?”****
This is a fundamental difference that is often overlooked in practice.****
Sales may see a growing pipeline.****
CFO may see stable cash flow.****
The delivery team may report full capacity.****
Each of these views is correct. Each is based on data.****
But none of them indicates whether the company is heading in the right direction as a whole.****
As a result, dashboards start to function as a set of parallel truths, rather than a single source of clarity. Data is available, but lacks a common decision-making context.
In theory, dashboards are supposed to speed up decision-making. In practice, in many companies, the opposite is happening.****
During board meetings:****
-
more time is spent interpreting numbers than making decisions,****
-
questions arise about metric definitions rather than action direction,****
-
each department defends its data view.****
Reports cease to be tools of clarity and become points of contention.****
This is not because they are poorly prepared.****
It is because they are not designed to support decision-making, but rather for reporting on the current state of affairs.****
Lack of decision clarity rarely manifests itself in one spectacular mistake. Its cost is more subtle - and therefore more dangerous.****
-
decisions are postponed because "data still needs to be checked",****
-
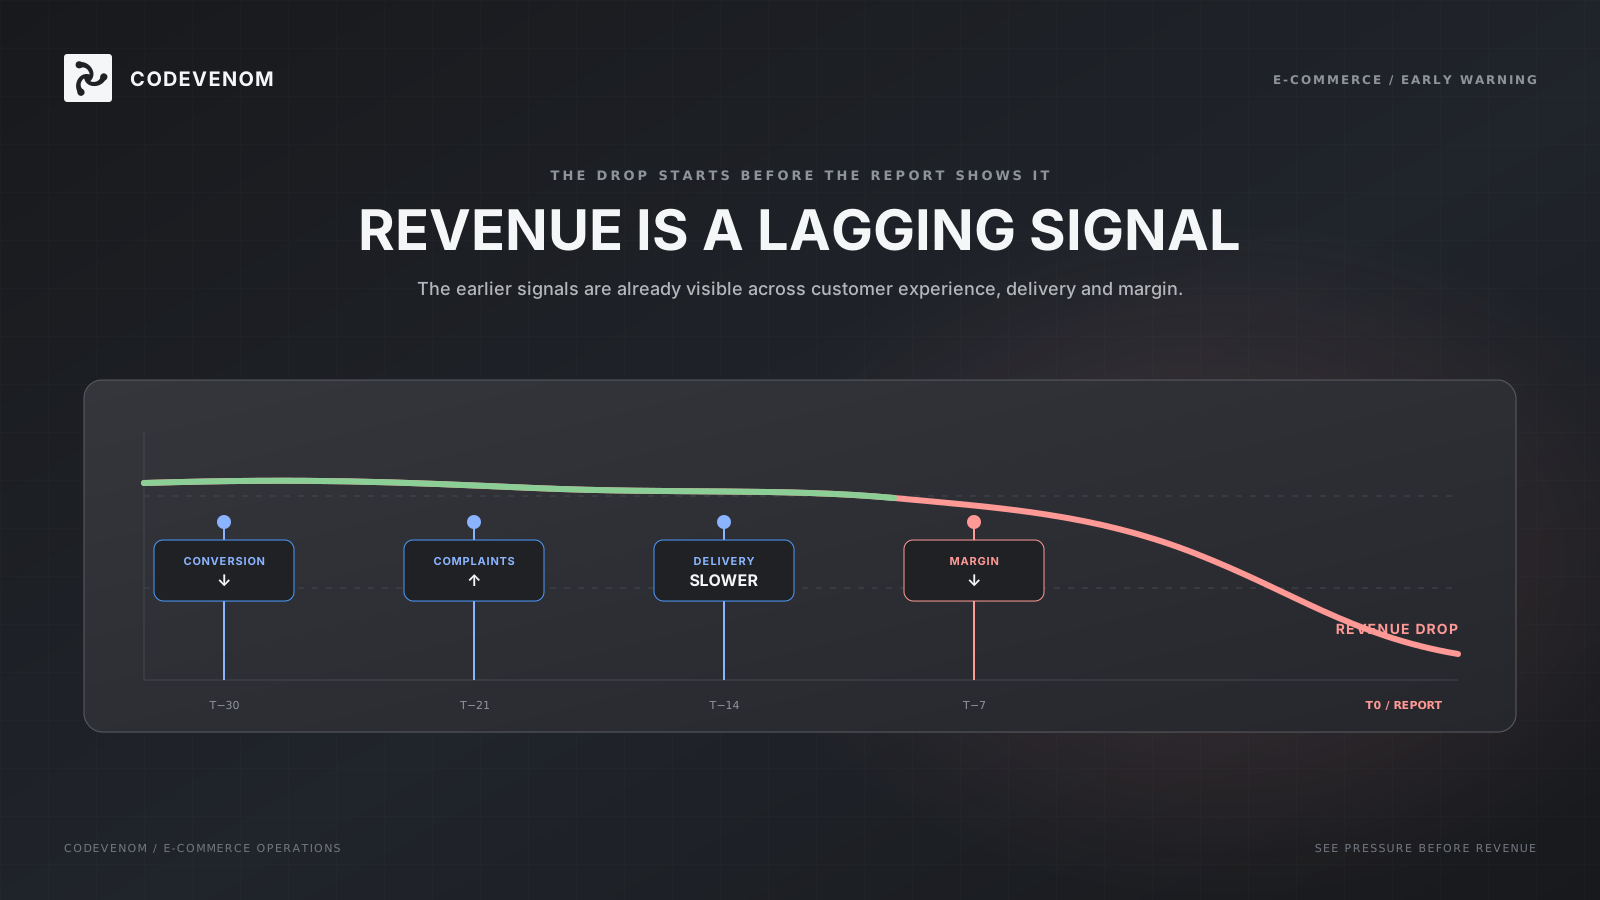
management reacts to symptoms instead of anticipating problems,****
-
teams receive conflicting priorities because they stem from different reports.****
The company is still functioning, but the pace of decision-making is beginning to lag behind the market. This is the moment when a competitive edge disappears not because someone made a mistake - but because decisions are made too late or without a full picture.
Mature companies do not reject dashboards.****
They stop expecting that dashboards will solve the decision-making problem.****
Instead, they separate two orders:****
-
reporting as a description of reality,****
-
clarity of decision-making as a separate layer.****
They no longer ask 'what KPIs to add?', but instead:****
-
which decisions are crucial today,****
-
what information is needed to make them,****
-
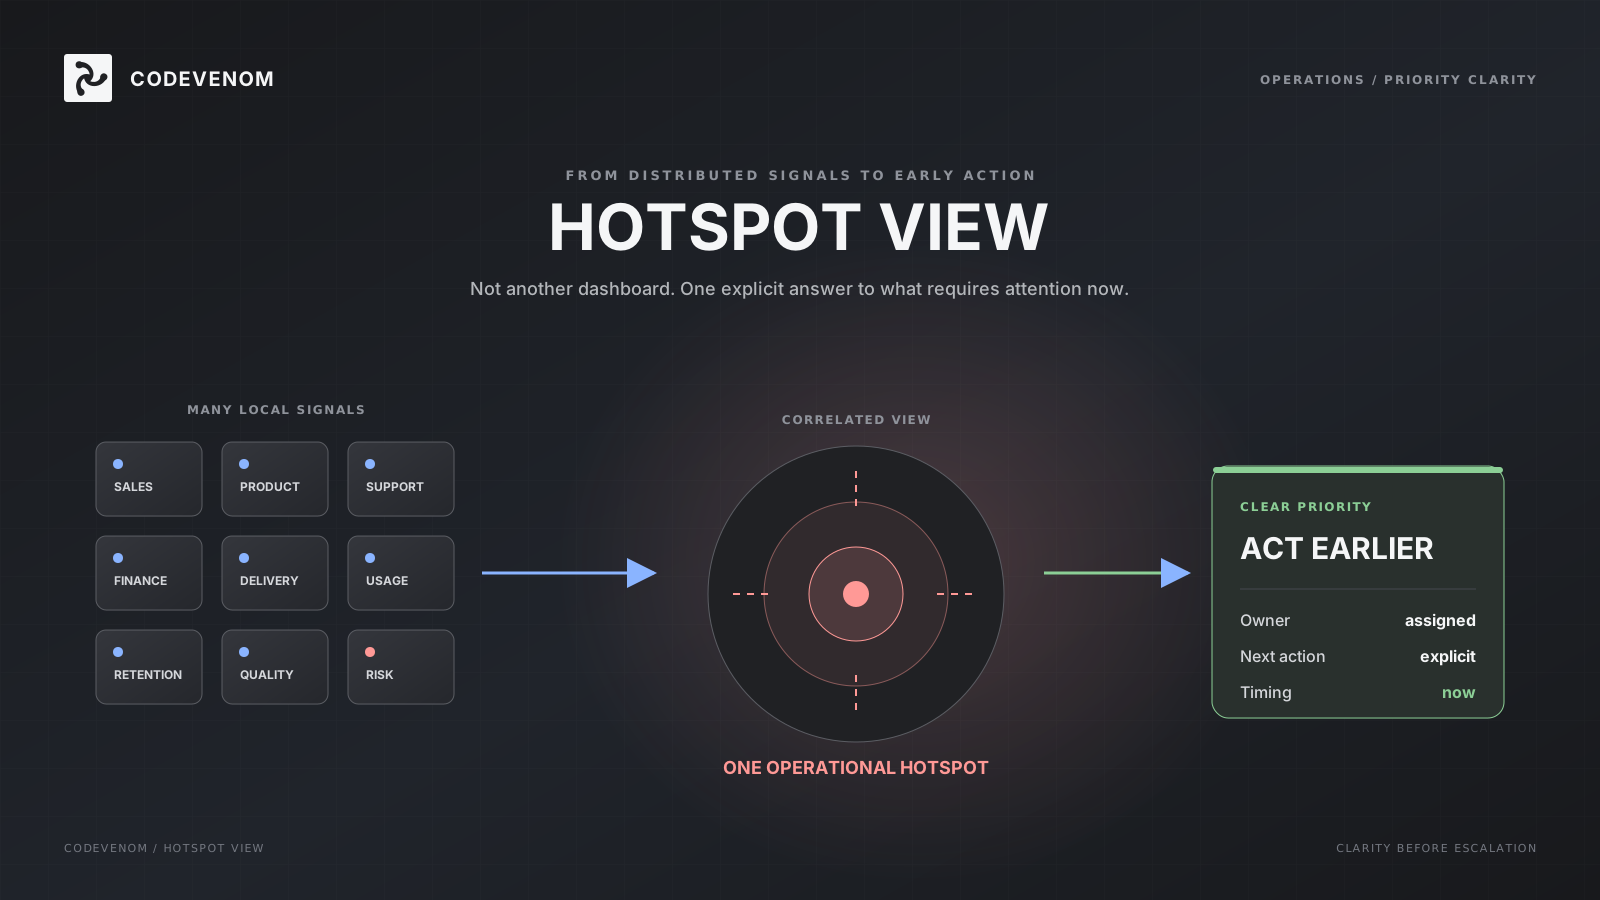
how to combine data from different areas into one operational picture.****
This does not require perfect models or complex BI.****
It requires a change of perspective: from data to decisions.
Lack of clarity doesn't mean that the company is poorly managed. It means that the company has grown faster than decision-making processes.****
At this point, the key question is not which tool to implement, but what role data should play in the decision-making process. Should they only describe the past, or actually help choose the direction for the future.****
If you feel that dashboards tell you a lot, but not necessarily the most important things - it's not an alarm signal. It's a signal that the organization is ready for a different level of clarity.****
If you want to consider what the decision layer above the reports would look like - it's worth discussing. Without presentations. Without sales. At the level of real decisions that the management deals with.